The BudStacks Guide · Part 5
The Numbers
Revenue, customers, and what's actually selling — measured from your own orders, not guessed.
In your admin: /tenant-admin/analytics
Key metrics and the date range
What it’s for
The top of the page answers "how is the store doing?" in four numbers, and then answers the more useful question underneath it: better or worse than last time?
What it does
- The 7 Days / 30 Days / 90 Days buttons at the top right set the period for everything below them. You land on 30 days.
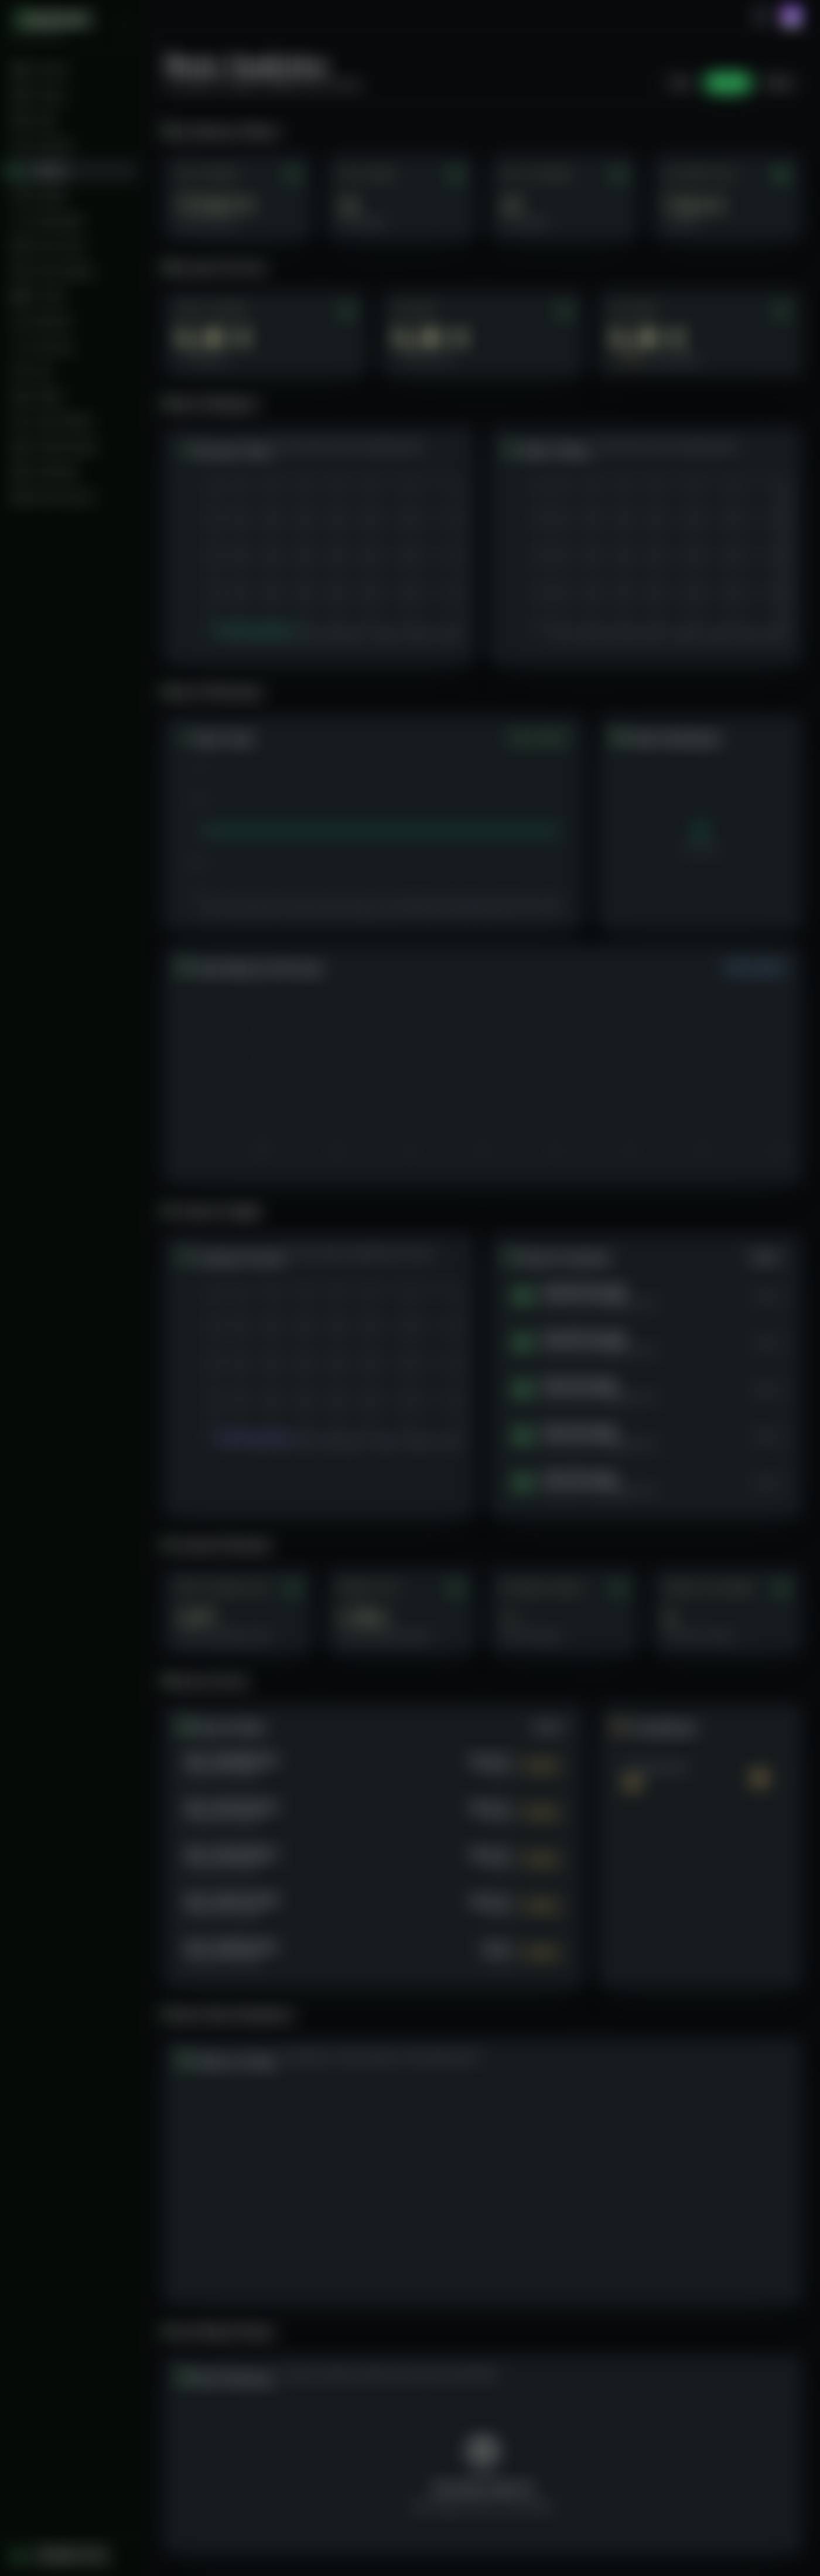
- Key Business Metrics gives you Total Revenue, Total Orders, Total Customers, and Average Order Value — all-time totals, each with what the selected period added underneath.
- Revenue Overview compares like with like: Today's Revenue against yesterday, This Week against the prior 7 days, This Month against the prior 30 days — each with the percentage change.
- Where there is nothing meaningful to compare against — your first week, a quiet yesterday — the change reads "—" rather than an invented 0%.
Try it: Read your week in 5 minutes
- Open Analytics and press 7 Days.
- Read This Week in Revenue Overview, and the percentage beside it.That percentage compares the last 7 days with the 7 before them. It is the number that tells you which direction you are travelling — the big totals only tell you how far you have come.
- Glance at Total Orders and Average Order Value together.Revenue up with orders flat means people are spending more per basket. Orders up with value down means the opposite. The two readings call for different responses.
- Scroll to Top Selling Products and note your top three — those are what to put in front of people this week.
- Check Recent Orders for anything stuck.An order still showing Pending days later is work, not data. Deal with it in the Order Desk (Part 3).
- Finish at Customer Retention: repeat rate, and how many customers are overdue to reorder.Those two numbers are the ones that change slowly and matter most. Write them down and compare next Monday.
Why you’ll use it
Most owners check their bank balance and call it analytics. The balance tells you what happened; the comparison tells you what is happening. Five minutes here on a Monday is enough to decide what to promote, what to restock, and who to email.
What's selling
What it’s for
The middle of the page is about demand: which days sold, and which products earned the money.
What it does
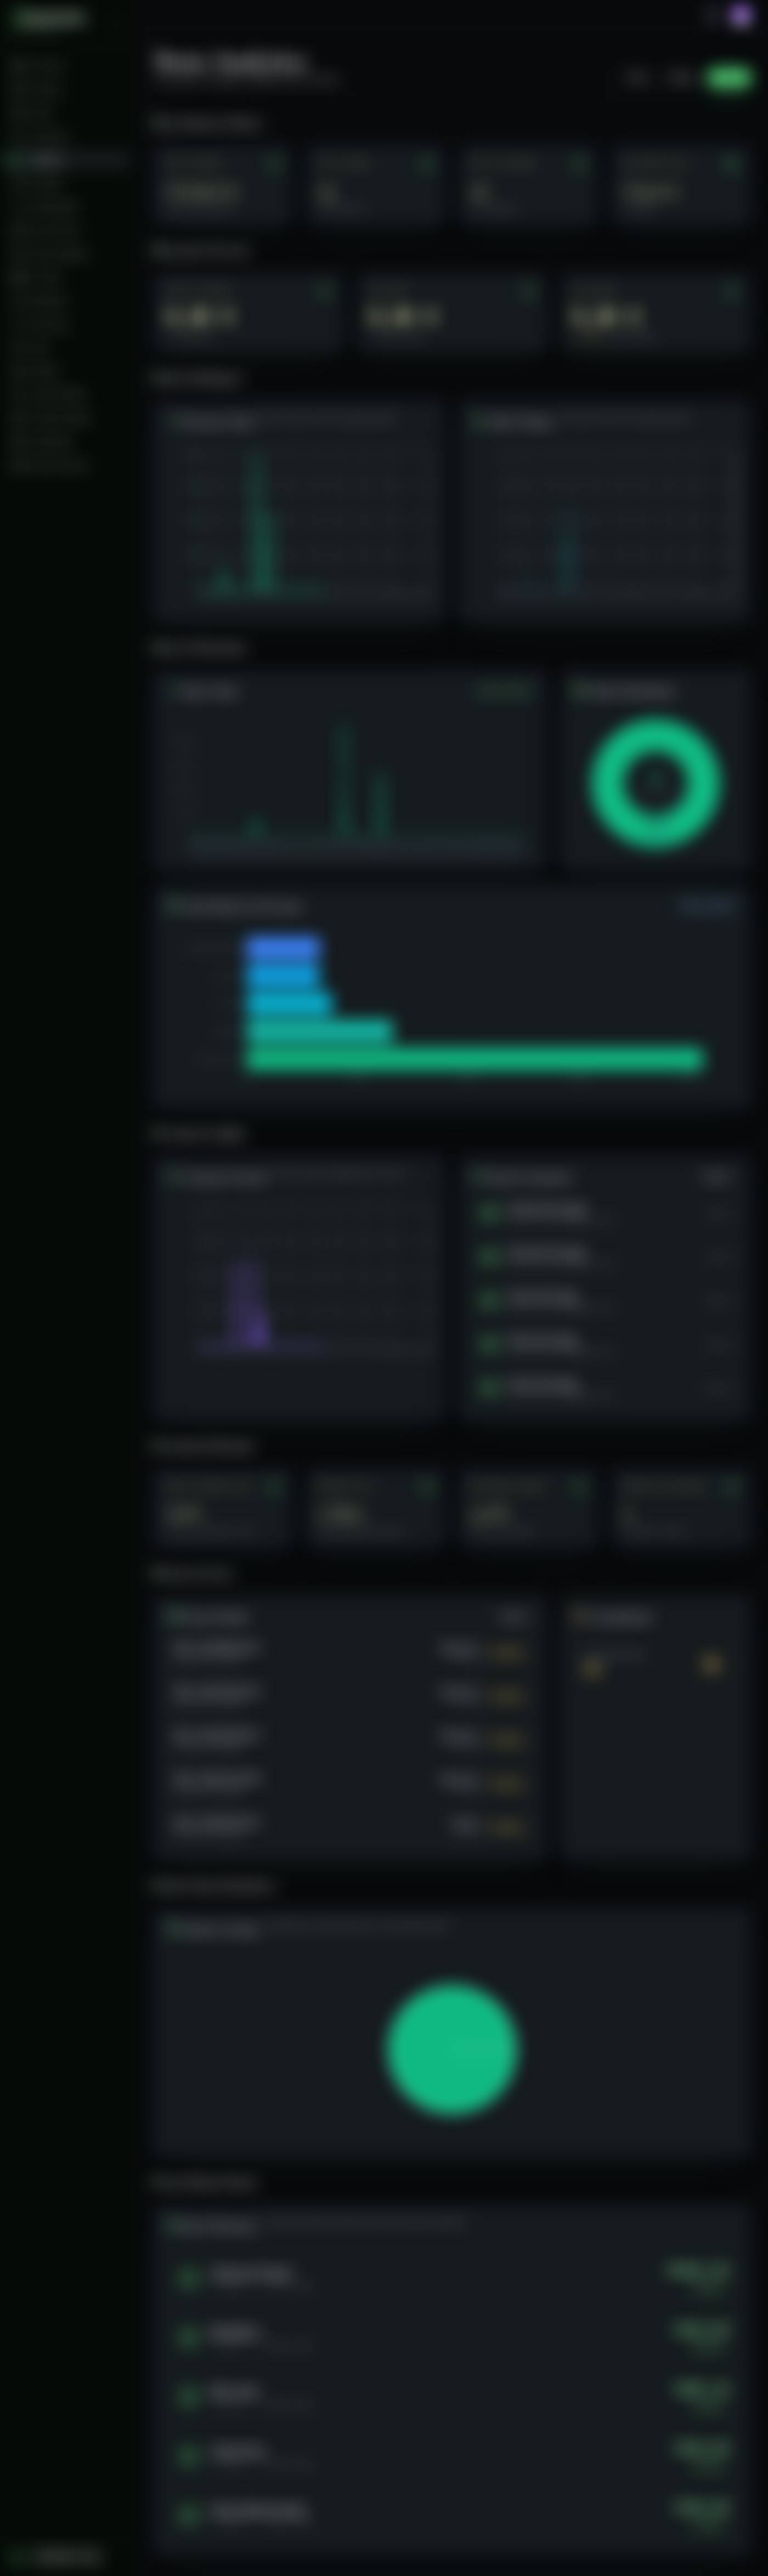
- Revenue Trend and Order Volume plot daily revenue and daily order count across the period. Days with no sales are drawn as zero rather than skipped, so a quiet week looks quiet instead of disappearing.
- Sales Trend repeats revenue in a larger chart, with the period named on the pill beside it.
- Order Distribution is a ring showing how the period's orders split by status, with the total in the middle.
- Top Products by Revenue ranks your best five by money earned — price multiplied by quantity, so a line with three units counts three times.
- Top Selling Products lists the same five in full: orders, units sold, and revenue each.
Why you’ll use it
Stock and attention are limited and instinct is unreliable — the product you like is rarely the product that pays. This section tells you which five to feature, which to reorder, and which quietly earn nothing.
- · A line reading "Unknown Product" means the catalogue entry behind that sale has since been removed. The sale is real; only the name is gone.
- · Top products are ranked within the selected period. Widen to 90 days before concluding something has stopped selling.
Customers and activity
What it’s for
Who is arriving, what just happened, and what is waiting on you.
What it does
- Customer Growth plots new registrations per day across the period.
- Recent Customers lists the five newest with how long ago they joined; View All opens the Customer Book (Part 4).
- Recent Orders lists the five most recent with number, customer, value, status, and age; View All opens the Order Desk (Part 3).
- Consultations shows how many consultation requests are waiting. Stores that verify customers by ID upload instead never see this card.
- Orders by Status breaks the whole period down by status — and deliberately counts cancellations, because that is the one place you want to see them.
Why you’ll use it
Growth and activity read together. A spike in sign-ups with no matching orders means people are getting stuck between registering and buying — that is a verification or checkout problem you can only see by looking at both.
Customer Retention
ProWhat it’s for
Four numbers about whether people come back. This is the difference between a shop that grows and a shop that runs hard to stand still.
What it does
- Repeat Purchase Rate: the share of your buyers who have ordered two or more times.
- Reorder Cycle: the typical gap between one order and the next — the middle value across your customers rather than the average, so one unusual customer cannot skew it.
- Returning Revenue: how much of the period's money came from customers who had bought before, as a percentage with the amount underneath.
- Overdue for Reorder: how many customers are past due. The threshold adapts to your store — half again your own typical cycle, held between 21 and 90 days — and the card tells you which number of days it used.
- Anything without enough history to measure shows "—" instead of a guess. A store with no second orders yet has no reorder cycle, and says so.
Try it: Find who's overdue to reorder
- Scroll to Customer Retention and read Overdue for Reorder — the count, and the "no order in N+ days" line beneath it.
- Write down that number of days.It is your store's own threshold, worked out from your own reorder pattern. A new store falls back to 45 days until there are enough repeat orders to measure.
- Open Email Templates, go to the Segments tab, and create a segment with the rule "last order more than N days ago" — N being the number you just wrote down. (Part 9, The Email Hub.)
- Save it and read the live count.Expect it to be lower than the analytics figure. A segment only counts customers who consented to marketing and haven't unsubscribed; analytics counts everyone who bought.
- Write one short campaign to that segment and send it.Come back in a fortnight and read Repeat Purchase Rate and Returning Revenue again — that is how you find out whether the email worked.
Why you’ll use it
Winning a new customer costs several times what it costs to bring an existing one back, and a repeat customer is the difference between a business and a series of transactions. These four numbers turn "we should follow up with people" into a specific list of people and a specific week to do it.
- · Every retention figure excludes cancelled orders, so a cancelled sale never makes your repeat rate look better than it is.
- · Repeat rate and reorder cycle are measured across your whole history; returning revenue is measured within the period you selected.
Where the numbers come from
What it’s for
Analytics is only worth having if you trust it. This is the short version of how every figure on the page is produced.
What it does
- Every figure is read from your own orders and customers at the moment you open the page. Nothing is sampled, estimated, rounded up, or left over from a demo.
- Cancelled orders are excluded from revenue, order counts, averages, top products, and retention — a cancelled sale can never inflate your numbers. The two deliberate exceptions are Orders by Status and Recent Orders, where seeing the cancellation is the whole point.
- Comparisons use windows that meet exactly: the prior 7 days end where the current 7 days begin. No overlap, no gap, nothing counted twice.
- A percentage appears only where a real prior period exists to compare against; otherwise you get "—".
- If the page cannot load your data it shows zeros and empty charts rather than inventing something to fill the space.
Why you’ll use it
You can quote these figures to an accountant, a lender, or a partner without checking them first — which is the only test of a reporting screen that actually matters.
- · Amounts are shown in euros whatever currency your store prices in. The figures are right; the symbol may not be.
- · Total Revenue counts every order that wasn't cancelled, including any not yet paid for. Money collected and money owed are not separated on this page yet.
- · Total Customers counts every customer record, including ones anonymised after an erasure request, so it can read slightly higher than the count in the Customer Book (Part 4).
- · Days are measured in UTC, so a late-night order can land in the following day's column.